
What can you NOT do with HTML5 Canvas element ? I can't think of any.
In this tutorial we will draw a graph that has grid lines and X & Y axis. The graph also has tick marks at the grid lines with corresponding values.
This graph can be later used to plot a mathematical equation or curve.
Live Demo
The below graph has a 25px grid width. X-axis is at 5 grid distance from the top, and y-axis is at 5 grid distance from the left. Values in the X-axis start from (1Î ), and values in Y-axis start from (1).
The below graph has a 20px grid width. X-axis is at 10 grid distance from the top, and y-axis is at 1 grid distance from the left. Values in the X-axis start from (2), and values in Y-axis start from (5).
Codes for the demo are provided towards the end for download.
Download Sample Codes
DownloadThe Concept Behind It
- You first set a grid size. For example 25px.
- Horizontal grid lines are drawn. Each line is separated by the grid size chosen (25px).
- Vertical grid lines are drawn. Each line is separated by the grid size chosen (25px).
- The origin of the graph (where the X-axis and Y-axis meet) is calculated from the top left corner of the canvas element in terms of no of grids.
For example the X-axis is set to be 4 grids away (25*4 = 100px) from the top of the canvas. A horizontal straight line is drawn here that denotes the X-axis.
Similarly the Y-axis is set to be 5 grids away (25*5 = 125px) from the left of the canvas. A vertical straight line is drawn here that denotes the Y-axis. - Conventionally origin of the canvas is its top left corner. And the graph we require has a different origin. This is illustrated below :
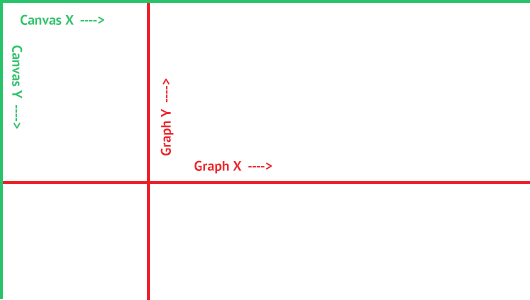 To simplify adding elements to the canvas, we shift the origin of the canvas. The origin of the canvas is translated to the origin of the graphical system.
Through the translation, the X-axis of the canvas and the graph coincide. But the Y-axis of the canvas is opposite to the Y-axis of the graph. So we must remember this while plotting points on the axes.
The current axes of both the canvas and the graph are illustrated below :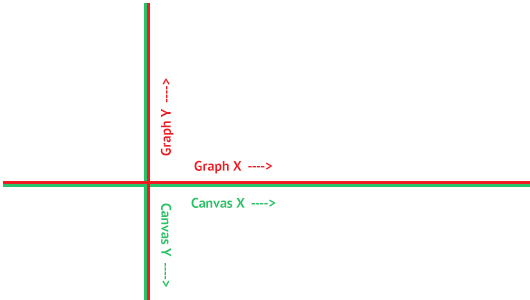
- Points are plotted along the axis of the graph. The first point is set through the code. Subsequent points are calculated by simply multiplying — (1, 2, 3, 4 ...) or (3, 6, 9, 12 ...).
Drawing 1px Crisp Straight Lines on the Canvas
Drawing crisp straight lines on the canvas requires adjustment of co-ordinate points by 0.5px. You can read more on this in HTML5 Canvas - Drawing 1px Crisp Straight Lines.
Now we shall implement the concept one by one through Javascript.
Step 1 : Setting Variables
We need to set some variables that will hold our preferences
- a variable that holds the grid size in px.
- a variable that holds the distance of the X-axis of the graph in terms of grid lines (from the top of the canvas). For example setting a value 5 would mean that the 5th line from the top is the X-axis.
- similarly a variable that will hold the distance of the Y-axis of the graph from the left of the canvas.
- a variable that will hold the initial starting point along the X-axis. This will be a combination of a number and a suffix string. If using only number and keeping the suffix empty we would get points like (1, 2, 3, 4 ..). If using both the number and a chosen suffix Î , we would get points like (1Î , 2Î , 3Î ..). On the negative X-axis we would get points like (-1, -2, -3, -4 ..) etc.
- similarly a variable holding the initial starting point along the Y-axis of the graph.
var grid_size = 25;
var x_axis_distance_grid_lines = 5;
var y_axis_distance_grid_lines = 5;
var x_axis_starting_point = { number: 1, suffix: '\u03a0' };
var y_axis_starting_point = { number: 1, suffix: '' };

var canvas = document.getElementById("my-canvas");
var ctx = canvas.getContext("2d");

// canvas width
var canvas_width = canvas.width;

// canvas height
var canvas_height = canvas.height;

// no of vertical grid lines
var num_lines_x = Math.floor(canvas_height/grid_size);

// no of horizontal grid lines
var num_lines_y = Math.floor(canvas_width/grid_size);
Step 2 : Drawing the X-axis and Horizontal Grid Lines
Vertical straight lines are drawn using the lineTo. If the line in question is recognized as the Y-axis, it is given a different color.
// Draw grid lines along X-axis
for(var i=0; i<=num_lines_x; i++) {
    ctx.beginPath();
    ctx.lineWidth = 1;

    // If line represents X-axis draw in different color
    if(i == x_axis_distance_grid_lines)
        ctx.strokeStyle = "#000000";
    else
        ctx.strokeStyle = "#e9e9e9";

    if(i == num_lines_x) {
        ctx.moveTo(0, grid_size*i);
        ctx.lineTo(canvas_width, grid_size*i);
    }
    else {
        ctx.moveTo(0, grid_size*i+0.5);
        ctx.lineTo(canvas_width, grid_size*i+0.5);
    }
    ctx.stroke();
}
Step 3 : Drawing the Y-axis and Vertical Grid Lines
Horizontal straight lines are drawn using the lineTo. If the line in question is recognized as the X-axis, it is given a different color.
// Draw grid lines along Y-axis
for(i=0; i<=num_lines_y; i++) {
    ctx.beginPath();
    ctx.lineWidth = 1;

    // If line represents Y-axis draw in different color
    if(i == y_axis_distance_grid_lines)
        ctx.strokeStyle = "#000000";
    else
        ctx.strokeStyle = "#e9e9e9";

    if(i == num_lines_y) {
        ctx.moveTo(grid_size*i, 0);
        ctx.lineTo(grid_size*i, canvas_height);
    }
    else {
        ctx.moveTo(grid_size*i+0.5, 0);
        ctx.lineTo(grid_size*i+0.5, canvas_height);
    }
    ctx.stroke();
}
Step 3 : Shifting the Origin of the Canvas to the Required Origin
Shifting the origin of the canvas can be done through translate in terms of no of grids.
Note that the origin and X-axis of the canvas now matches with the origin and X-axis of the graph, but their Y-axis are opposite. This means that the y-coordinate of each element drawn in the canvas will be negative of the actual.
ctx.translate(y_axis_distance_grid_lines*grid_size, x_axis_distance_grid_lines*grid_size);
Step 4 : Drawing Tick Marks with Values Along the X-axis
Tick marks in the form of 6px straight lines are drawn, with respresenting text at each tick mark.
// Ticks marks along the positive X-axis
for(i=1; i<(num_lines_y - y_axis_distance_grid_lines); i++) {
    ctx.beginPath();
    ctx.lineWidth = 1;
    ctx.strokeStyle = "#000000";

    // Draw a tick mark 6px long (-3 to 3)
    ctx.moveTo(grid_size*i+0.5, -3);
    ctx.lineTo(grid_size*i+0.5, 3);
    ctx.stroke();

    // Text value at that point
    ctx.font = '9px Arial';
    ctx.textAlign = 'start';
    ctx.fillText(x_axis_starting_point.number*i + x_axis_starting_point.suffix, grid_size*i-2, 15);
}

// Ticks marks along the negative X-axis
for(i=1; i<y_axis_distance_grid_lines; i++) {
    ctx.beginPath();
    ctx.lineWidth = 1;
    ctx.strokeStyle = "#000000";

    // Draw a tick mark 6px long (-3 to 3)
    ctx.moveTo(-grid_size*i+0.5, -3);
    ctx.lineTo(-grid_size*i+0.5, 3);
    ctx.stroke();

    // Text value at that point
    ctx.font = '9px Arial';
    ctx.textAlign = 'end';
    ctx.fillText(-x_axis_starting_point.number*i + x_axis_starting_point.suffix, -grid_size*i+3, 15);
}
Step 5 : Drawing Tick Marks with Values Along the Y-axis
Tick marks in the form of 6px straight lines are drawn, with representing text at each tick mark. Keep in mind that the Y-axis of the canvas and graph are opposite in direction.
// Ticks marks along the positive Y-axis
// Positive Y-axis of graph is negative Y-axis of the canvas
for(i=1; i<(num_lines_x - x_axis_distance_grid_lines); i++) {
    ctx.beginPath();
    ctx.lineWidth = 1;
    ctx.strokeStyle = "#000000";

    // Draw a tick mark 6px long (-3 to 3)
    ctx.moveTo(-3, grid_size*i+0.5);
    ctx.lineTo(3, grid_size*i+0.5);
    ctx.stroke();

    // Text value at that point
    ctx.font = '9px Arial';
    ctx.textAlign = 'start';
    ctx.fillText(-y_axis_starting_point.number*i + y_axis_starting_point.suffix, 8, grid_size*i+3);
}

// Ticks marks along the negative Y-axis
// Negative Y-axis of graph is positive Y-axis of the canvas
for(i=1; i<x_axis_distance_grid_lines; i++) {
    ctx.beginPath();
    ctx.lineWidth = 1;
    ctx.strokeStyle = "#000000";

    // Draw a tick mark 6px long (-3 to 3)
    ctx.moveTo(-3, -grid_size*i+0.5);
    ctx.lineTo(3, -grid_size*i+0.5);
    ctx.stroke();

    // Text value at that point
    ctx.font = '9px Arial';
    ctx.textAlign = 'start';
    ctx.fillText(y_axis_starting_point.number*i + y_axis_starting_point.suffix, 8, -grid_size*i+3);
}
Thats it. By changing the values of the grid lines and initial values of tick marks, you can get a graph of your choice.